Deep Dives › Big Questions
Big Questions · Energy and AI infrastructure · 15 November 2026
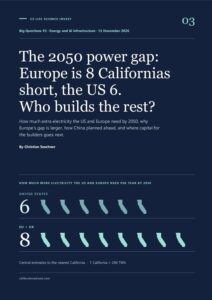
The 2050 power gap: Europe is 8 Californias short, the US 6. Who builds the rest?
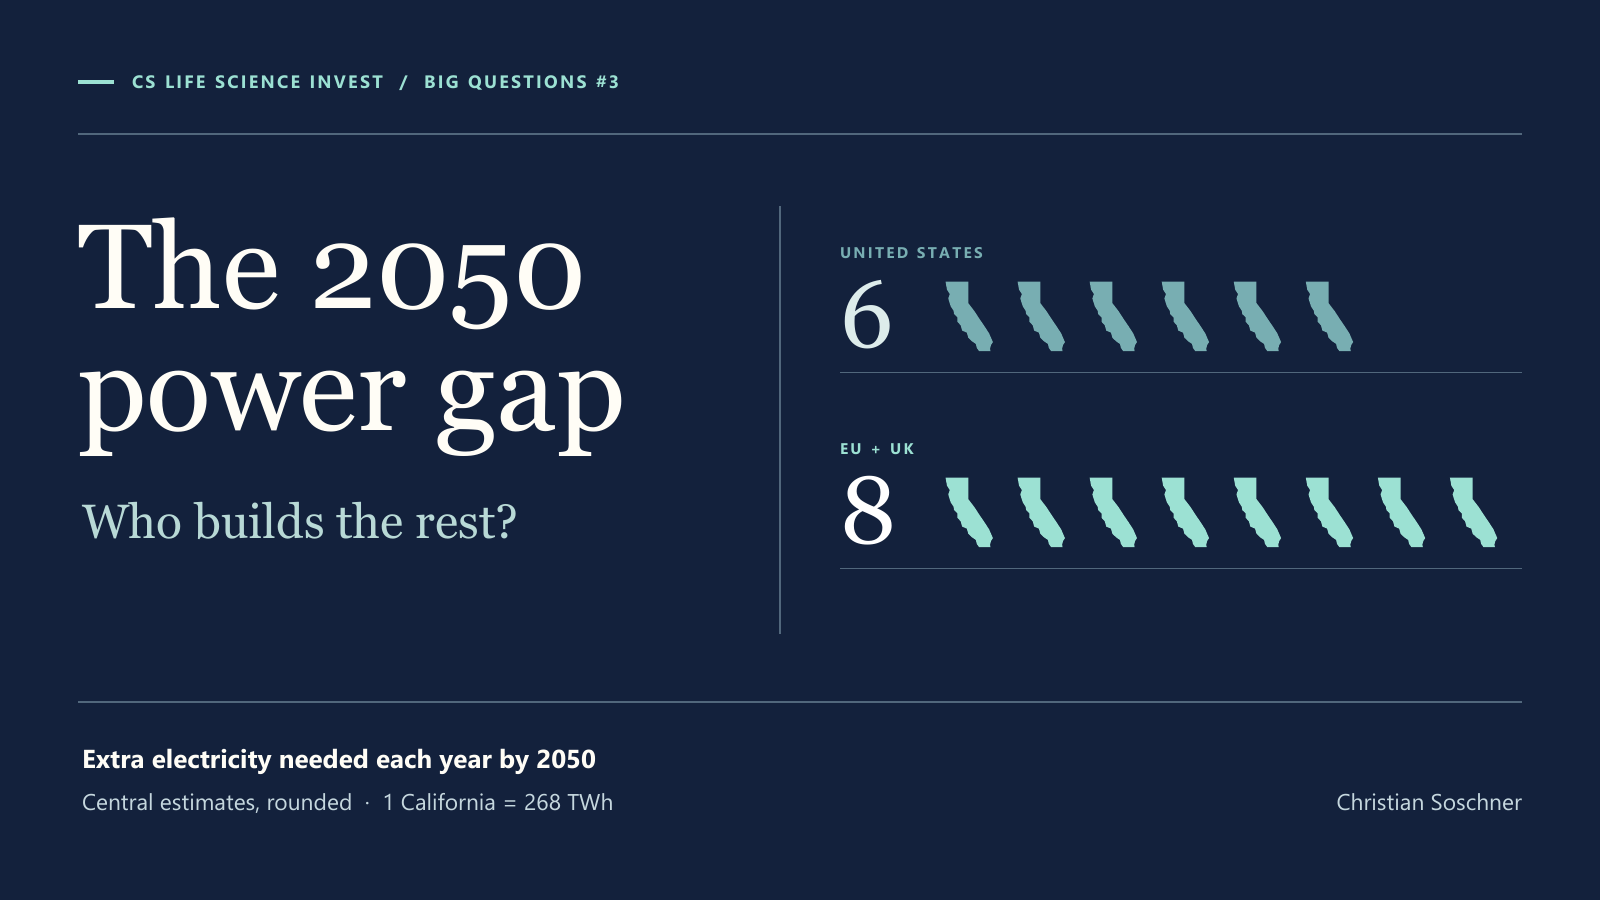
The US needs about 6 Californias of extra electricity a year by 2050, the EU and UK about 8. Europe’s gap is larger, most of it comes after 2030, and its energy-intensive industry pays more than twice the US price for power, according to the IEA. What both regions lack is builders: turbines, transformers, cables, grid crews and the capital that pays for them. China planned ahead.
By Christian Soschner, 26 years building companies
The answer first
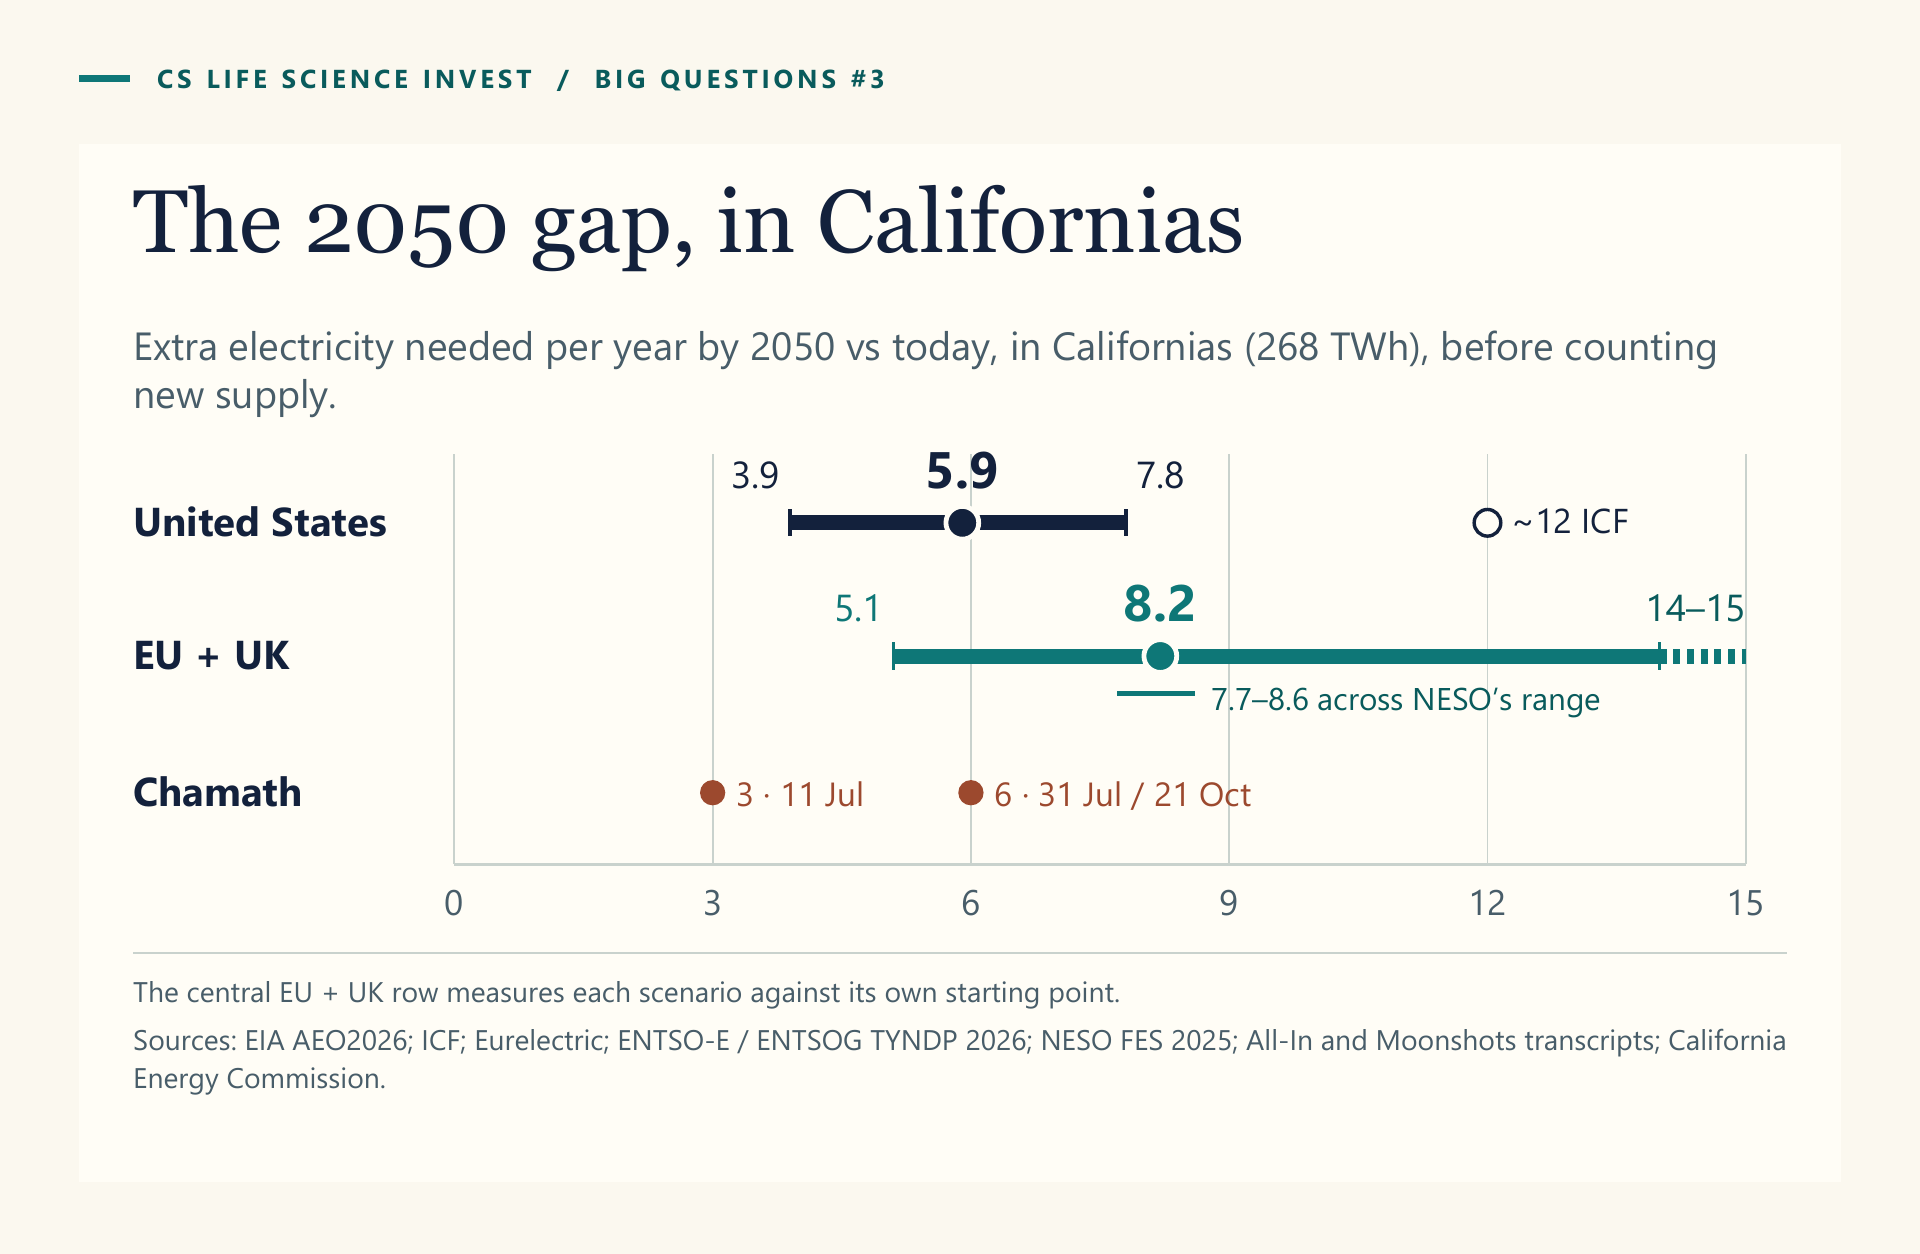
- The US needs about 6 Californias of extra electricity a year by 2050, on the midpoint of the US government’s range (4 to 8), and close to 12 on a higher private forecast.
- The EU and UK need about 8 Californias in the central case, with a range of 5 to 15. Against today’s use, that is about +80% for Europe and about +40% for the US.
- What both regions lack is builders. Turbine makers have sold their gas turbine slots into 2032, and large transformers take three to four years to deliver.
- Europe adds a price problem. Energy-intensive industry pays more than twice the US price and about 50% more than in China, according to the IEA.
- Austria’s and Italy’s nuclear bans date from the 1970s and 1980s. In my view, Austria and Europe need to reconsider their position.
- My read: the region that keeps the energy price below 10 cents per kWh, with low fixed charges on the bill, attracts the builders of the next decade. Today that region is China.
Key facts
- One California is 268 TWh, the state’s total electricity supply in 2025. The US consumed a record 4,195 TWh last year, almost 16 Californias; the EU and UK about 3,100 TWh, close to 12.
- The EU and UK have about 520 million people, about 50% more than the US with 342 million, and use about 26% less electricity: about 6 MWh per person a year, against about 12 in the US.
- The US Energy Information Administration expects US electricity demand to grow 25% to 50% by 2050, with electric vehicles and data-centre servers behind 50% to 80% of the growth.
- NERC expects North American summer peak demand to rise by about 224 GW over ten years, more than four times the all-time peak of California’s main grid.
- Europe’s grid companies need 2,820 new power transformers and about 34,000 km of HVDC cable by 2035 (ENTSO-E).
- The EU’s average industrial power price was €151 per MWh in 2025, against €74 in the US (ACER).
- China used 10,368 TWh in 2025 and added about 494 TWh in one year, 1.8 Californias.
Testing Chamath’s number
Chamath Palihapitiya made the California unit popular, and his own number has moved: three Californias on All-In on 11 July 2026, six on 31 July, and six again on Moonshots in October, this time as the gap that remains even after builders finish every planned project. Three falls below both the US government’s range and ICF’s forecast. Six matches the middle of the government range. The gap is larger than the number most people first heard.
The near-term numbers are smaller than the headlines. According to Bloomberg, Wood Mackenzie expects utilities to commit to about 28% of the 1,066 GW requested for US data-centre projects, and Grid Strategies finds the utilities’ 2030 data-centre forecasts about 25 GW too high. My read is that the timing of the US gap moves with AI spending, while its size by 2050 rests on cars, heating and industry as much as on data centres.
Europe’s gap is larger: 8 Californias
Europe’s demand is flat today: the EU used 2,774 TWh in 2025, still 3.6% below 2019. The plans for 2050 are large. The central scenario of Europe’s transmission grid companies lifts EU final electricity demand from 2,380 TWh in 2023 to about 4,220 TWh, and Britain’s grid planner NESO sees up to 797 TWh. Together that is about 8 Californias, roughly +80% on today’s base, and most of it comes after 2030.
Europe’s bottleneck today is wires and connections. Britain’s connection queue reached 722 GW in September 2024 before reform, Spain granted about 12% of the roughly 40 GW of demand-connection requests in 2025, and Germany curtailed 9.4 TWh of renewable power last year.
Why Europe’s power price decides where builders go
In each bidding zone and hour, the most expensive plant needed to meet demand sets the price for all generators, and gas set the EU price in 40% of hours in 2024. Austria shows what that means on a household bill: before 2022 the energy part stood at about 8 to 10 cents per kWh for almost a decade; index-linked tariffs moved into the range of 40 to 60 cents by late 2022, and the jump fed inflation across the economy. Prices have come down since and remain well above the old level.
Companies are leaving. In Germany, one in three large industrial companies is already moving production abroad in response to energy costs and policy, according to the DIHK, and in Austria one company in six is considering moving at least part of its business abroad. My conclusion is that prices have to go back below 10 cents per kWh for the energy itself, and the fixed charges on the bill cannot become the substitute.
Who pays for the wires
The European Commission estimates that EU electricity grids need €1.2 trillion of investment by 2040, €730 billion of it in distribution networks, and its Grids Package of December 2025 proposes Europe-wide planning and faster permits. That is real progress, and it deserves credit. The money is a different question. In 17 of 26 countries that ACER surveyed, no large distribution grid company is majority private, and public decisions set the pace of the build. Governments move at the speed of budgets and elections. In Austria, my home market, government spending reached 54.6% of GDP in 2025.
The private capital to build exists, and Europe can line it up. The incentives decide where it goes. The condition for Europe is clear: private money at scale, earning returns that compete with the US and Asia, on a grid plan that keeps its dates. When Europe meets that condition, its largest gap becomes its largest building programme in a generation.
Nuclear: Europe’s rules are older than the technology
Austria voted against nuclear power at Zwentendorf on 5 November 1978, and parliament wrote the ban into the constitution in 1999. Italy voted its reactors out in 1987, a year after Chernobyl. The technology has improved since then, and the new approaches target build time: Bret Kugelmass of Last Energy described his approach on Beginner’s Mind as a plan to reinvent “the construction paradigm and leave the reactor alone.” Belgium, Sweden, Denmark and Italy have started to move, and nuclear already supplies about 23% of the EU’s electricity.
Austria and Europe, I believe, need to reconsider their position on nuclear energy. In my view, for most regions it is the only reliable source of energy at the scale the next decades require, and the obstacle is regulation.
China planned ahead
China built every type of power plant at scale. In 2025 it commissioned 78 GW of new coal plants, added about 74 GW of energy storage and connected 438 GW of new wind and solar, and clean generation covered all of its demand growth. Its energy-intensive industry pays about a third less than its European competitors, according to the IEA, and on 14 November 2026 COMAC’s 19-seat all-electric CE-25A completed its first crewed flight. In my view, China is far ahead of both Europe and the US on this question.
The builders: where capital goes next
The constraint in both regions is the capacity to build, and the order books show it. GE Vernova has sold gas turbine delivery slots for 2032, Siemens Energy closed its 2026 fiscal year with a €164 billion backlog, and in the US connection queue only 13% of the capacity that applied between 2000 and 2020 was operating by the end of 2025.
- Gas turbines and firm power equipment: GE Vernova, Siemens Energy, Mitsubishi Heavy Industries.
- Transformers, switchgear, power management: Hitachi Energy, Siemens Energy, Schneider Electric, Eaton, Hubbell.
- High-voltage and HVDC cable: Prysmian, Nexans, NKT.
- Grid construction: Quanta Services.
- Data-centre power and cooling: Vertiv, Schneider Electric.
- Firm clean generation: Constellation Energy, Rolls-Royce SMR, Last Energy.
The list names companies as examples of each layer. None of them is a recommendation.
The 10-cent test
Can your region deliver energy below 10 cents per kWh, net and before grid fees and taxes, with low fixed charges, at the scale its plans require?
For policymakers, the condition is speed: connection rules, permits, nuclear rules that match today’s technology, and returns that bring private capital into the grid. For investors, the attention goes to the builders whose order books stretch into the 2030s. The power price decides where builders put their next plant.
What to watch
- 30 November to 1 December 2026: EU energy ministers on the Grids Package.
- January 2027: NERC’s 2026 Long-Term Reliability Assessment.
- 27 January 2027: GE Vernova’s fourth-quarter results and 2027 outlook.
- 18 February 2027: Schneider Electric’s full-year results.
- Next: the final TYNDP 2026 scenarios for Europe’s grid.
Read the full report
The full report tests Chamath’s claim against the US government’s and ICF’s forecasts, sizes Europe’s gap scenario by scenario, shows how Austria’s power bill and Europe’s industrial prices developed, follows the money behind the grid, traces Europe’s nuclear rules from Zwentendorf to today, measures China’s build and maps the builders with their order books.
Your Next Move
An energy, siting or capital decision in front of you? Your Next Move: Executive Advisory Session gives you an experienced outside view on the one decision in front of you, in three steps.
See Your Next MoveThis analysis is for information only and is not investment advice or a recommendation to buy or sell any security. The author may hold positions in the companies discussed.